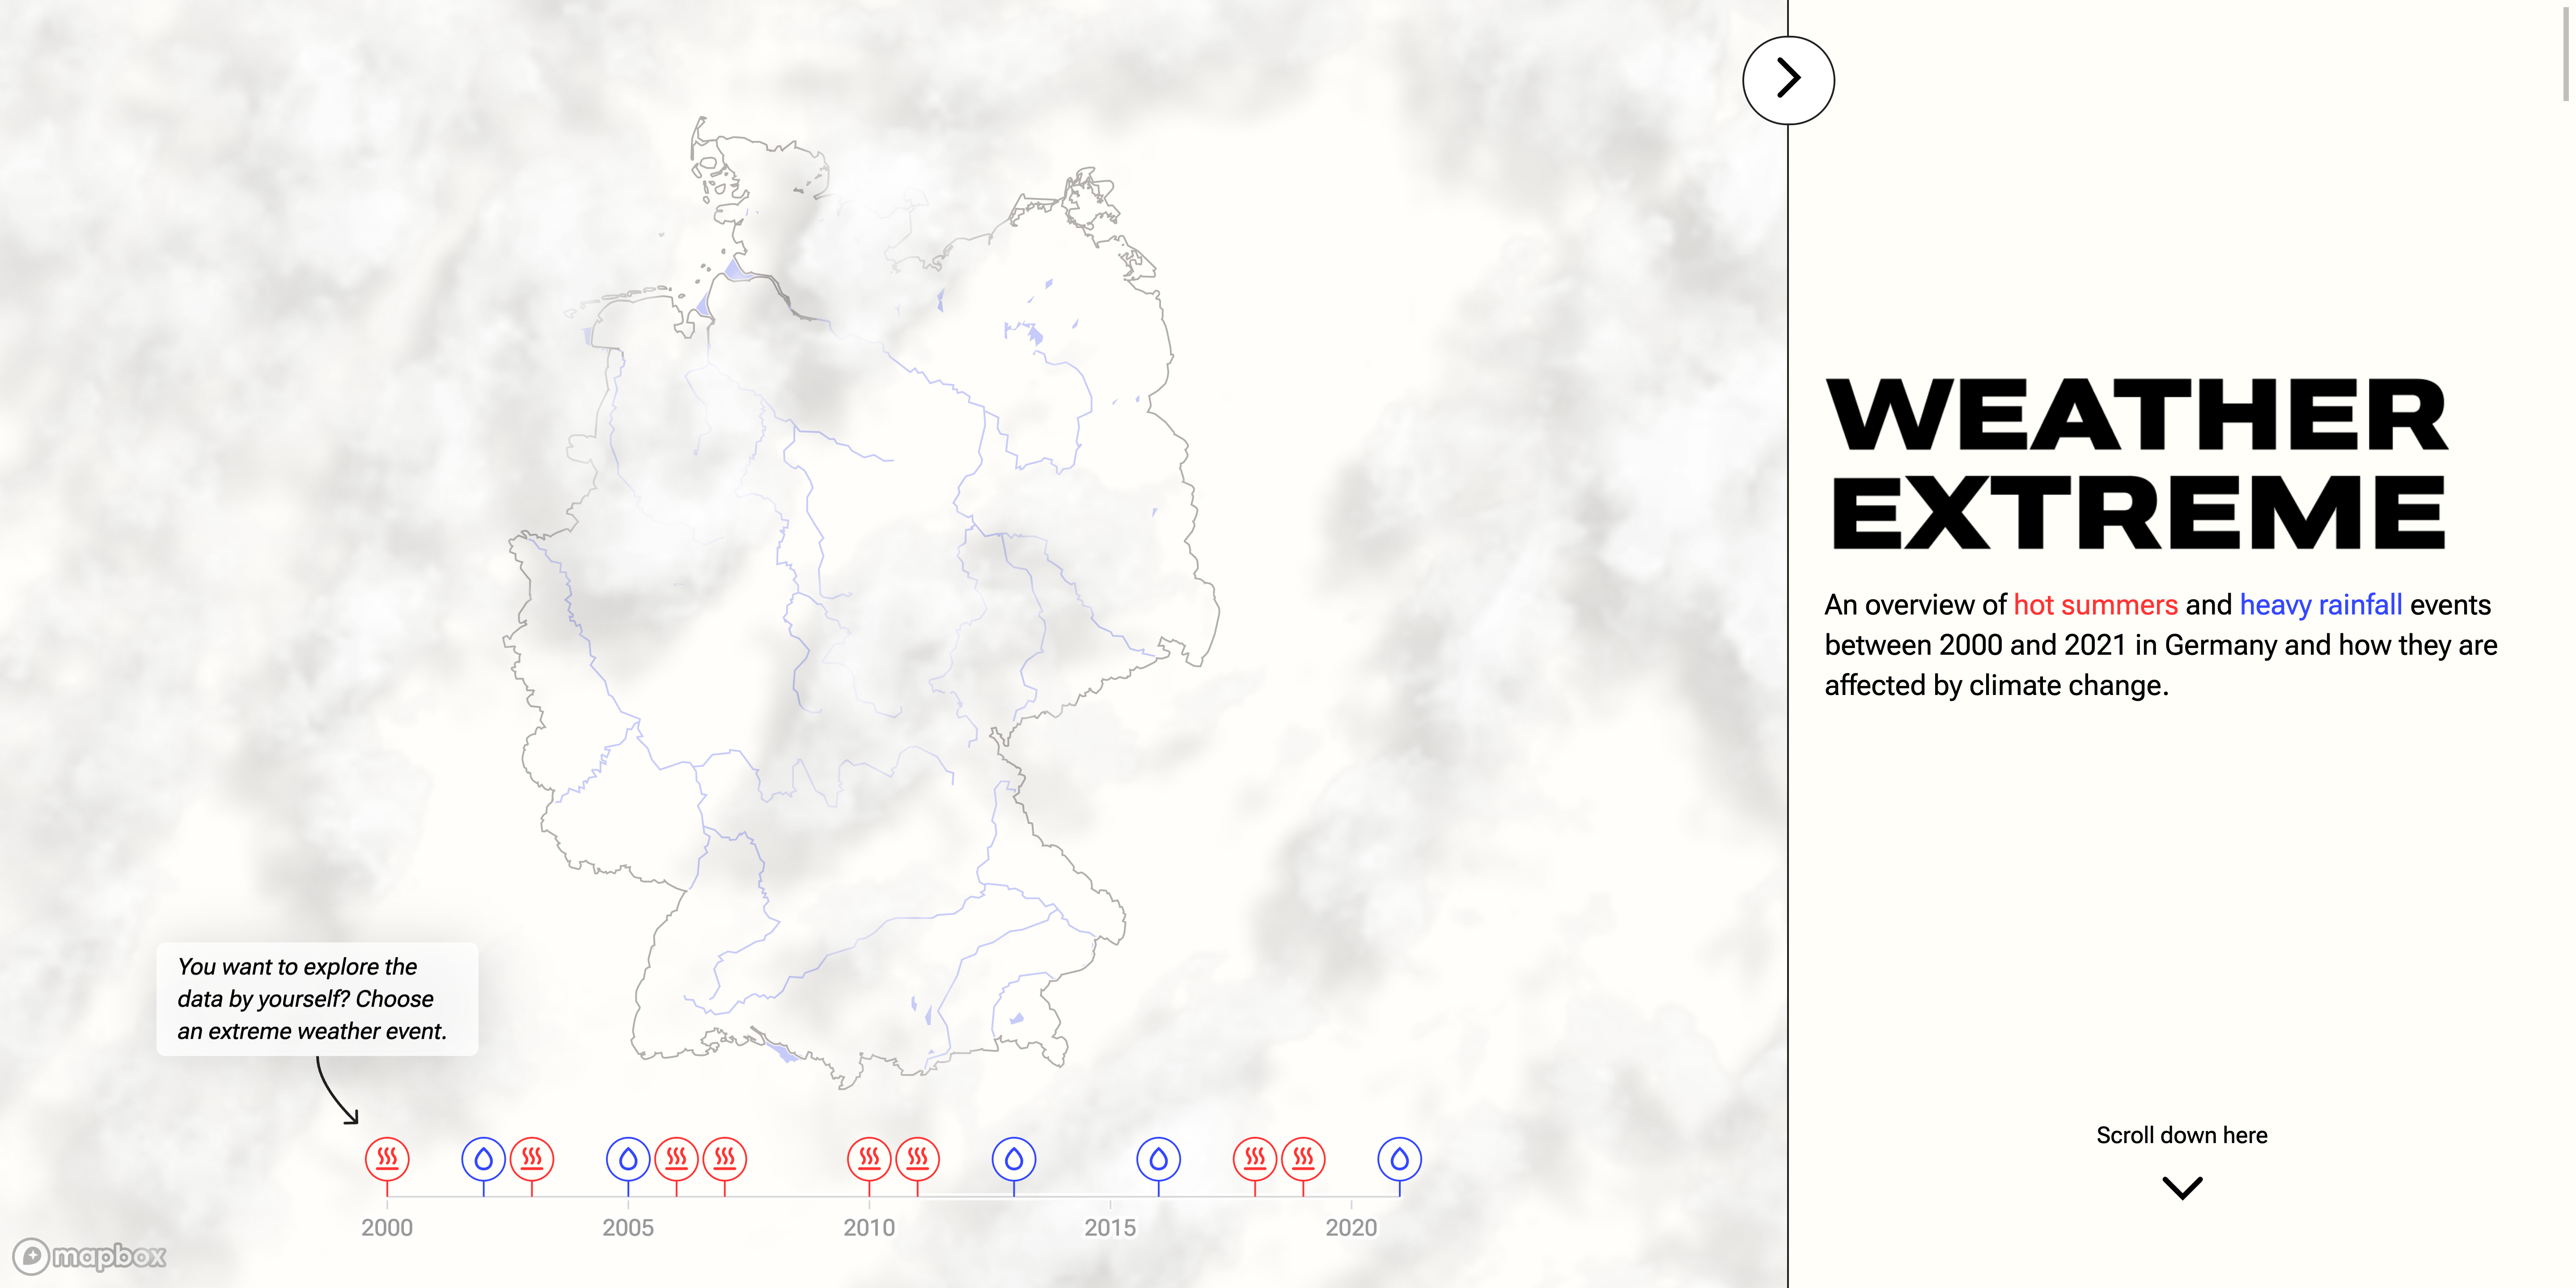

Weather ExtremeShowing extreme weather caused by climate crisis
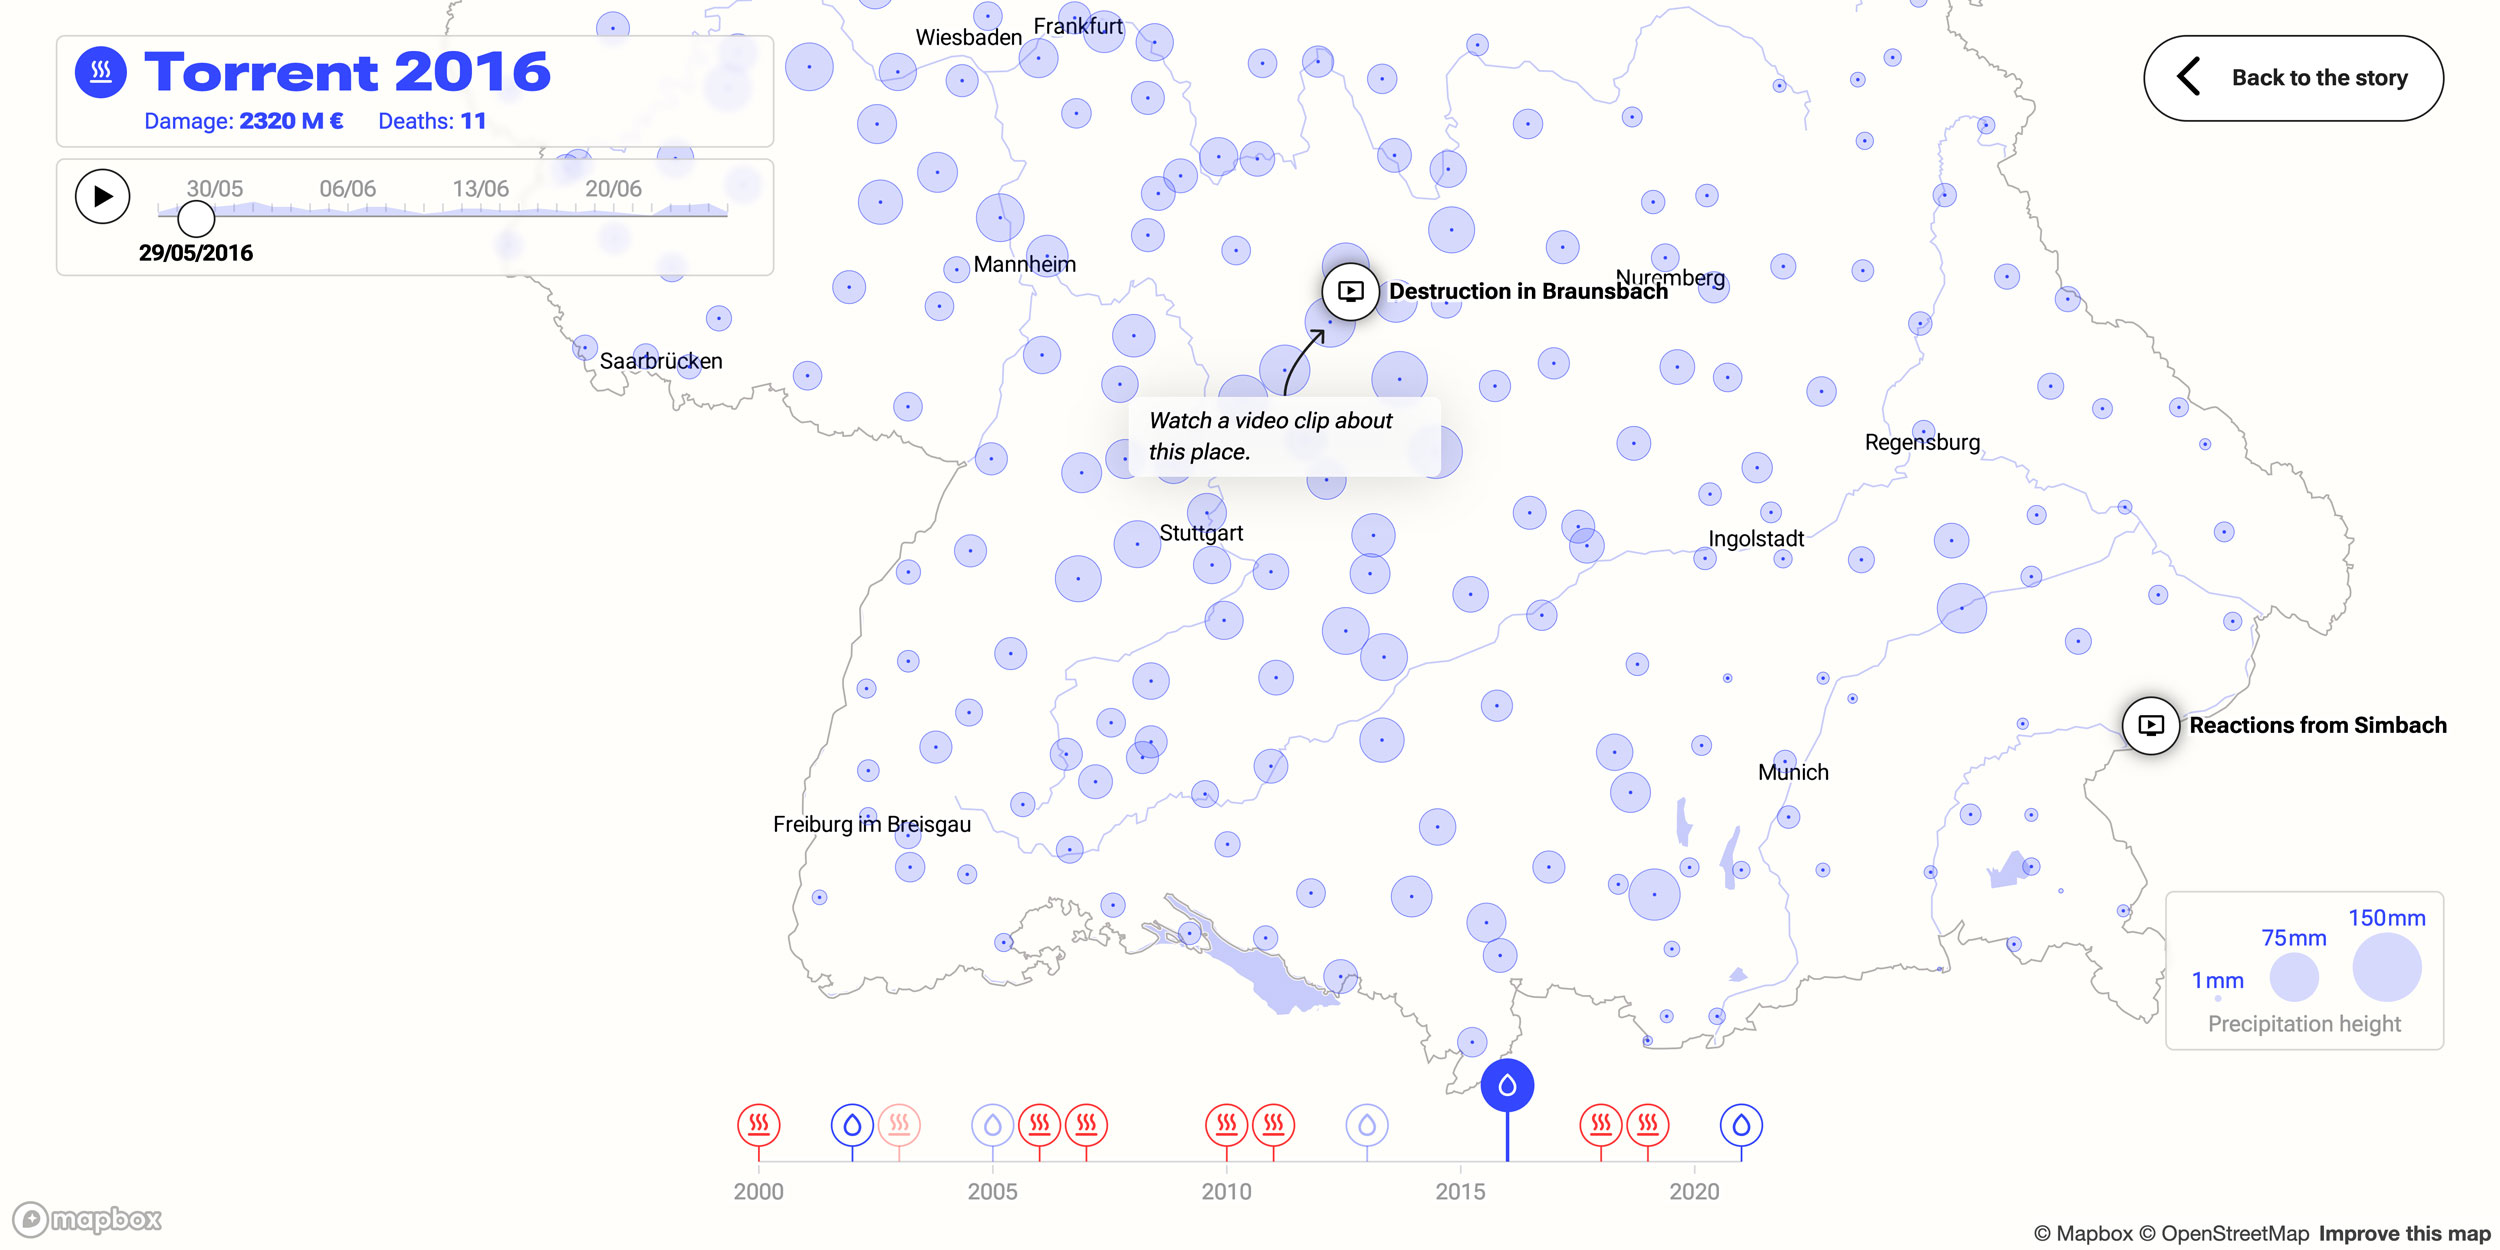
Climate change has a direct impact on the intensity and frequency of heavy rainfall and heat waves. This is shown by the IPCC reports from 2021. The interactive data story ‘Weather Extreme’ visualises extreme weather events in Germany between 2000 and 2021. The website combines a narrative with an explorative storytelling approach: readers can scroll through a linear story to extreme weather events or select events of their own interest. All data used is presented on a map. Data from the German Weather Service can be used to trace the course that led to an event. In addition, qualitative data in the form of video clips show the effects of heat waves and floods for affected areas. This combination of quantitative data and emotional reports is also reflected in the design style.